Correlations Between Regional Economic Indicators and High-Stakes Table Game Volumes in Non-Traditional Gaming Markets
Petra Weber · Jul 30, 2026

Correlations Between Regional Economic Indicators and High-Stakes Table Game Volumes in Non-Traditional Gaming Markets
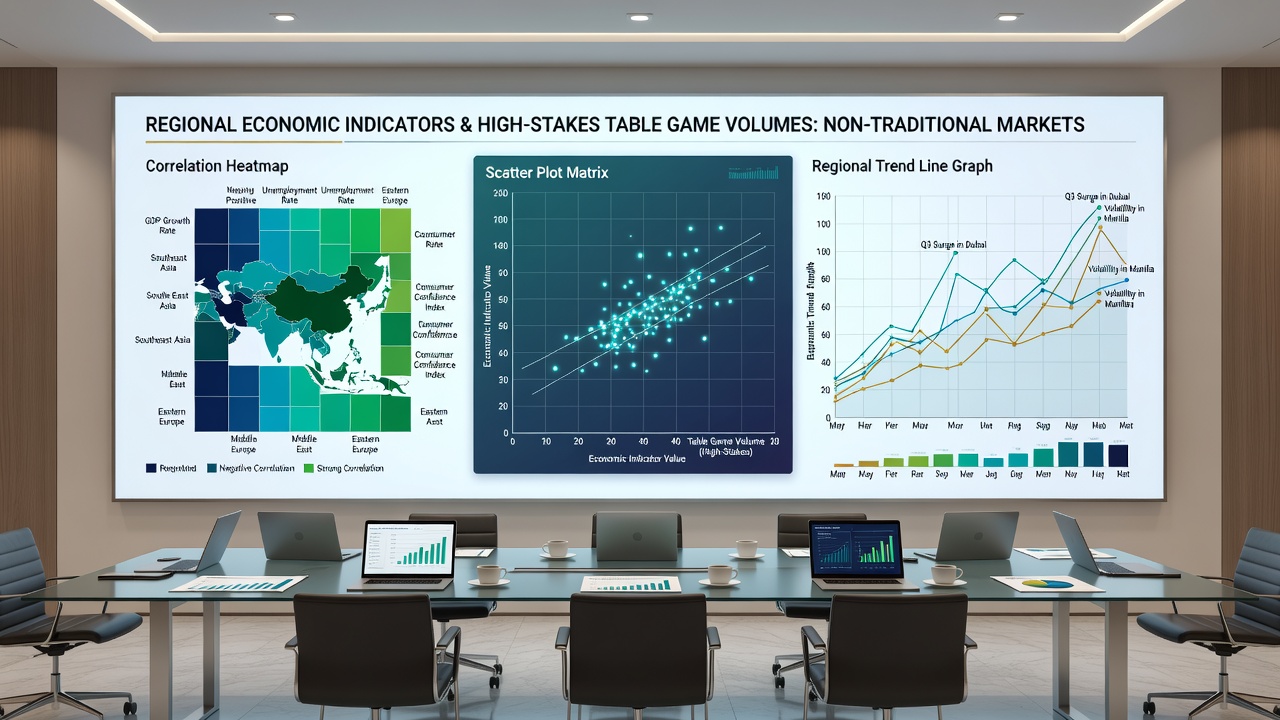
Analysts track connections between local economic signals and activity levels at premium table games across newer casino jurisdictions where operators have entered markets only in the past decade. These markets range from certain Australian regional centers to select Canadian provinces and emerging US state venues outside established hubs like Nevada or New Jersey. Data from government statistical agencies shows patterns where shifts in gross domestic product, tourism arrivals, and employment rates align with changes in high-stakes baccarat and blackjack drop figures.
Economic Indicators That Influence Gaming Activity
Regional GDP growth often moves alongside increased volumes at high-limit tables because higher disposable income supports larger wagers. In markets where per capita income rises by 3 percent or more annually, reports indicate corresponding lifts in average bet sizes at baccarat pits. Unemployment rates present a contrasting picture since lower joblessness tends to free up spending power for entertainment yet sustained high employment can also signal broader economic stability that encourages repeat visits from local players.
Tourism metrics provide another layer since visitor counts from international and domestic sources directly feed table game participation in non-traditional locations. Airports serving casino regions record passenger surges that coincide with elevated high-stakes play during peak seasons. Currency exchange fluctuations add further nuance because favorable rates for foreign visitors can boost volumes at games favored by high-net-worth travelers from Asia and the Middle East.
Patterns Observed in Specific Non-Traditional Markets
Queensland data reveals that periods of strong coal export revenues correlate with higher baccarat turnover at regional casinos because local business owners increase entertainment budgets. Similar alignments appear in British Columbia where resource sector performance tracks with blackjack volumes at newer integrated resorts. Observers note that these relationships strengthen when operators introduce private gaming salons designed for premium customers who respond quickly to local economic tailwinds.
Studies from academic institutions such as those affiliated with the University of Nevada Las Vegas Center for Gaming Research highlight how employment growth in service industries near new casino developments supports sustained high-stakes activity. When regional unemployment drops below 5 percent, average daily table drop at limits above $500 per hand often increases by double-digit percentages over the prior year. These trends hold across multiple jurisdictions even as regulatory frameworks differ.
Data Sources and Measurement Approaches
Statistical agencies compile monthly gaming reports that regulators cross-reference with economic releases. In Australia the Queensland Government Statistician's Office publishes detailed breakdowns of table game revenue segmented by bet size. Canadian provincial gaming corporations release comparable figures that researchers match against employment and retail sales data from Statistics Canada. These datasets allow analysts to calculate correlation coefficients between quarterly economic releases and high-stakes volumes without relying on anecdotal reports.
July 2026 figures from several emerging markets showed continued alignment between tourism recovery metrics and premium table performance. Passenger arrival numbers at key gateways rose 8 percent year-over-year while high-limit baccarat drop increased at a similar pace in the same regions. Analysts continue to monitor whether these patterns persist through seasonal slowdowns later in the year.
Challenges in Establishing Direct Causation
Multiple external factors can influence both economic indicators and gaming volumes simultaneously. Marketing campaigns by casino operators, introduction of new game variants, and changes in tax treatment of winnings all affect player behavior independently of broader economic conditions. Researchers therefore apply multivariate regression models to isolate the contribution of specific indicators such as GDP or visitor arrivals.
Seasonality introduces another variable since holiday periods and major sporting events drive table game activity regardless of local employment trends. Data sets that span at least five years help smooth these effects and reveal underlying relationships. Markets that opened casinos within the last ten years provide particularly useful case studies because baseline volumes were low enough for percentage changes to register clearly against economic shifts.
Conclusion
Available records demonstrate measurable associations between selected regional economic indicators and high-stakes table game volumes across non-traditional gaming markets. Government statistical releases and regulatory filings supply the raw numbers that allow ongoing tracking of these relationships. Continued data collection through 2026 and beyond will clarify whether current patterns remain stable as more jurisdictions enter the gaming sector and as economic conditions evolve.